In today’s changing digital landscape, marketers know that having good data and analytics are vital for understanding the impact of their digital marketing efforts. After all, in order to drive performance and prove ROI, you have to be able to measure what’s working and what’s not so you can address issues and capitalize on opportunities.
While digging into your brand’s own web and marketing analytics is an absolute must, understanding how you measure up to your industry peers can bring more insight and context—something TrackMaven’s 2017 Digital Marketing Analytics Performance Report aims to help with.
To create the report, TrackMaven used its digital marketing analytics platform to analyze a year’s worth of data—including social media performance, blog performance, public relations performance, and website health metrics—from over 700 businesses. The end product not only highlights trends, but also provides benchmarks and analysis of the most effective marketing channels across 13 industries and 39 sub-sectors.
Below we share five interesting takeaways, as well as some tips for using these insights to boost your efforts.
#1 – The higher education industry is killing it on social media.
According to the report, higher education institutions saw the highest social media follower growth across the social media landscape, averaging a 77% annual growth in followers. Of course, engaging social media content was a correlated factor, with the education industry ranking sixth in engagement out of the 13 industries analyzed.
Tip: Get to know your audience inside and out. From my perspective, achieving both follower growth and high engagement is directly tied to knowing who your audience is and using that information to deliver relevant, inspiring and valuable content.
Also, take some time to peruse social pages for higher ed institutions to get a feel for what their strategy is. Are they sharing tons of blog content? Are they highlighting students? Are they asking engaging questions? While your industry may be wildly different from higher education, you’ll likely find something worth tailoring and testing with your audience.
Achieving both follower growth & high engagement is directly tied to knowing who your audience is. Share on X#2 – Don’t underestimate the power of Pinterest for B2B.
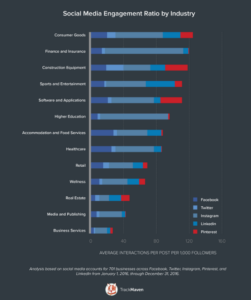
While Instagram was found to be the overall engagement winner—with 12 out of the 13 industries seeing the highest engagement ratio on that platform—Pinterest is also an engagement driver, particularly for B2B brands.
As you can see in the graph below, for B2B industries such as software and applications and construction equipment, Pinterest is getting more engagement on average than Facebook, Twitter and LinkedIn.

While this little tidbit did not get a special call out in the report, TrackMaven has highlighted Pinterest’s “hidden value” for B2B in the past, saying: “B2B marketers need to stop thinking of Pinterest as a simple bulletin board and start thinking of it as your company’s whiteboard.”
Tip: Most social media platforms are meant for communication, Pinterest is all about providing a place for users to discover new things and ideas, and find inspiration for all areas of their lives. Create boards that intertwine industry-specific topics, as well as boards that allow you to share your own compelling content and showcase your brand’s personality.
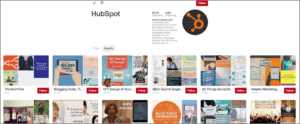
HubSpot is a great example of all this in action. With nearly 60 different boards, HubSpot shares fun facts, inspiring quotes, an inside look at their company culture, client spotlights and tons of marketing content.

Some other B2B brands to look to for inspiration include FedEx, IBM, Adobe and Microsoft.
Read: Is Pinterest Still Alive & How Are Brands Using It?
#3 – Brands can take a content cue from the sports and entertainment industry.
According to the report, sports and entertainment brands have the strongest blog content performance on social media, with an average of 12,098 social shares per blog post. Of course, it’s also important to note that these brands are publishing an average of 55 blog posts per month—which comes in second for most posts published after the media and publishing industry, for obvious reasons.
Of course, sports and entertainment brands have one distinct advantage over other industries—timely, newsworthy items pop up pretty often, which gives them interesting content on the regular. But they’re still contending with competitors and news feed algorithms to get eyeballs to their content.
Regardless, for me the report findings still show that consistently publishing relevant, entertaining and valuable content, and amplifying it across your digital channels, is an absolute must.
Tip: Create a content creation and amplification calendar, that also builds in flex time to cover breaking industry news or timely topics that your audience will care about.
Build in flex time to cover breaking industry news or timely topics. @CaitlinMBurgess #digitalmarketing Share on X#4 – Website health varies widely from industry to industry.
To assess website health, TrackMaven averaged a year’s worth of Moz Domain Authority scores and ranked industries from lowest to highest—revealing a wide gap between industries.
For a quick overview, Moz’s Domain Authority is a 100-point logarithmic scale that uses more than 40 signals such as total number of links, MozRank and MozTrust to determine the strength of a website. Typically, sites with higher domain authority should fare better in organic search results—something of obvious importance to all brands.
According to the report, media and publishing brands ranked at the top with an average score of 86.23. Ranking at the bottom with 58.35 was the wellness industry. Those industries with scores under 60 get “failing grades” for website health, the report said.
Tip: Take advantage of Moz’s free tools to check the health of your website. Start by downloading and installing the free MozBar to get a high-level glance at what your Domain Authority looks like. In addition, use the Open Site Explorer option to see what quality link building opportunities exist, as well as get the scoop on how your competitors are doing, too. If you want to dive deeper, sign up for a free Moz Pro trial.
#5 – PR is an opportunity for all.
The higher education, media and publishing, and sports and entertainment industries consistently ranked at the top of performance areas in this report—and PR performance was no different. While more press mentions doesn’t necessarily equal more social shares of that mention, it’s clear that getting a little PR only adds to your digital marketing success.
Tip: Start building relationships with key industry news sites and publications, as well as industry thought leaders. Get on their radar by following and engaging with them on social media. When the time is right, reach out to introduce yourself and comment on the good work they’re doing.
Also, if you’re in the practice of sending out press releases, offer to give an exclusive interview with a key player in your organization. Journalists love exclusivity, and this could help you get your message out.
Finally, if you do get some good PR, amplify the crap out of it. If they’ve taken the time to write something good about you, thank them for it. This will also help you to continue to build that relationship.
If you get some good PR, amplify the crap out of it. @CaitlinMBurgess #digitalmarketing #socialmedia Share on XWant More Digital Marketing Analytics Performance Insights?
Read the full TrackMaven report here.
How do you plan to up the effectiveness of your digital marketing efforts this year? Tell us in the comments section.


